The short version of a widely-shared Japanese investor note in mid-April 2026:
"The Nikkei is up nicely today and made a new all-time high. People who bought at the timing flagged in the prior post probably got a good entry."
That is the entire note. Twenty words. It contains more useful information for a US investor than most thousand-word "Japan rally" pieces because it implicitly asks the right question: who actually captured the move, and what does the answer tell you about your own process?
This is informational only. The disclaimer is at the end.
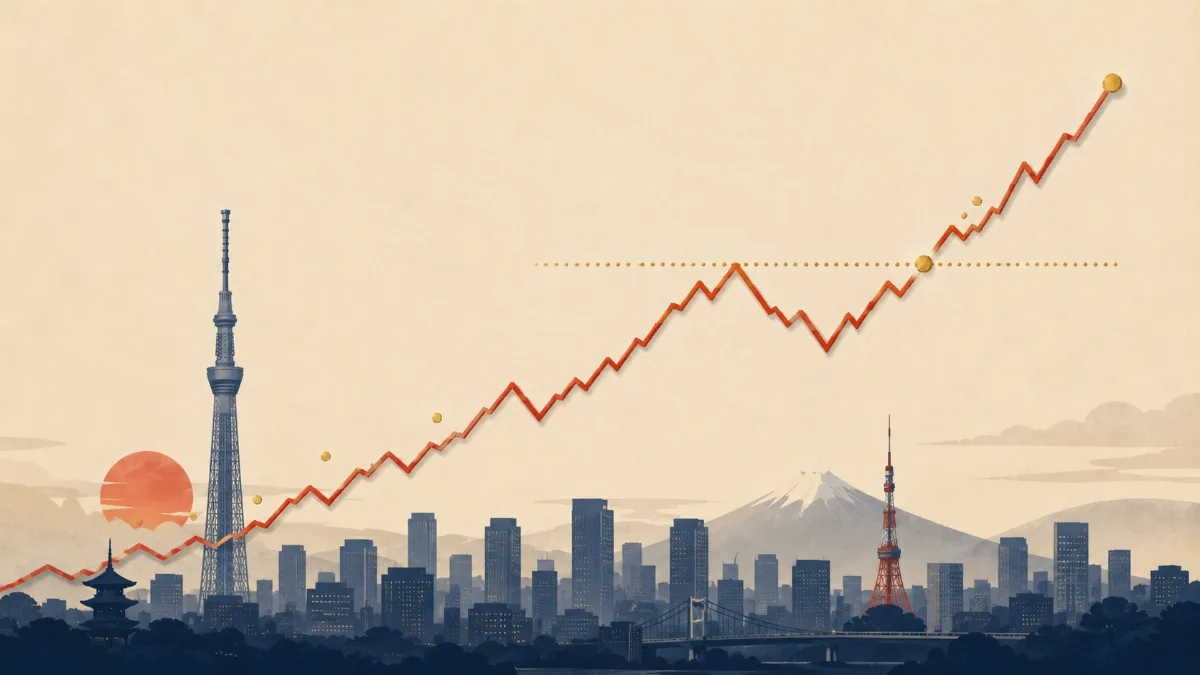
The headline
The Nikkei 225 cleared its prior all-time high in mid-April 2026, then extended into early May. Volatility (Nikkei VI) that had briefly spiked toward COVID-era levels during the March drawdown has compressed back to normal ranges.
The move is not a melt-up. Daily ranges look ordinary. Turnover is healthy but not extreme. Breadth — the share of names participating — has been distributed rather than concentrated in a handful of names (though see the Nikkei-vs-TOPIX caveat below).
Who actually captured this rally
The note above implies a specific answer: people who bought during the March drawdown are the ones who got the meaningful entry. Working backward through the time series tells you the same story:
- March 2026: Drawdown of ~13% on geopolitical shock. The Nikkei VI spiked. Headlines were uniformly bearish. This was the entry window.
- Early April 2026: Recovery began. The headlines flipped from "Japan in crisis" to "Japan recovering," roughly a week behind the price.
- Mid-April 2026: New all-time high. The headlines flipped again to "Japan record high." The investors getting this signal are already late.
- May 2026: The discussion shifts to "is this sustainable" — which is the question the disciplined investor was asking in March, not now.
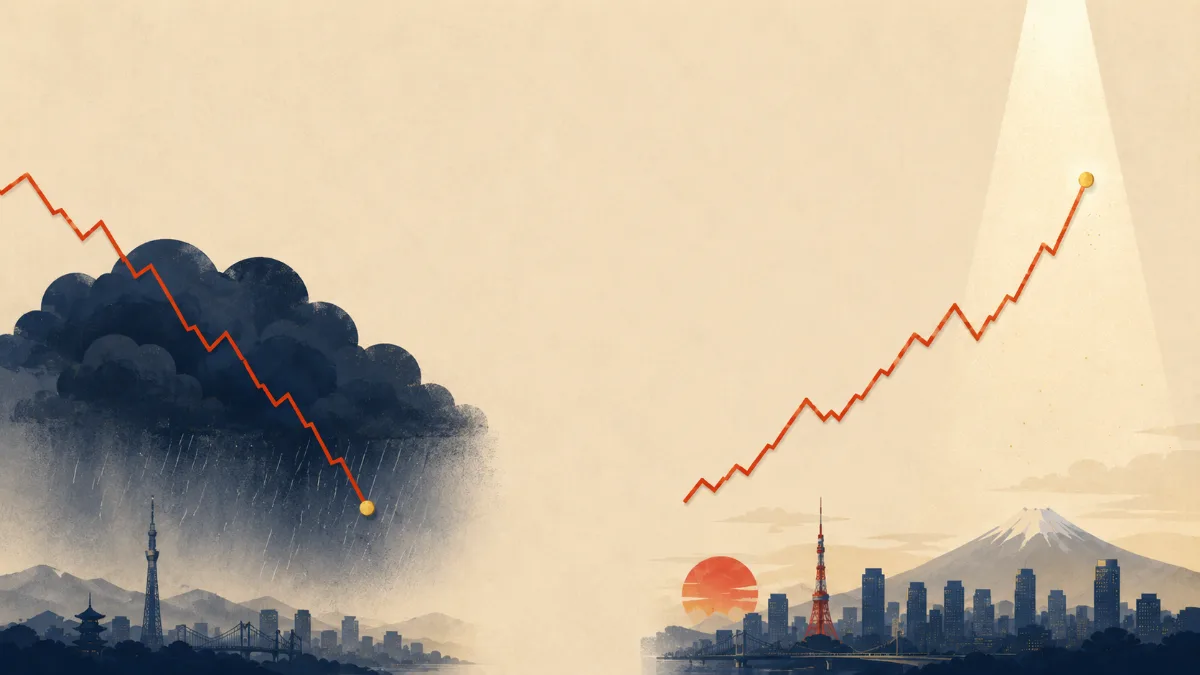
The mental model worth internalizing is that the useful headline almost always lags the useful entry by 6–8 weeks. The investors captured by the May 2026 "Nikkei record" headline are usually the ones who froze in March. The investors with positions today are usually the ones who bought when it was uncomfortable.
The useful headline almost always lags the useful entry by six to eight weeks.
On timing vs. process
This is not a Japan-specific observation. The same pattern played out in US equities in early 2024, in late 2022, in March 2020. The mechanism is the same: financial media re-prices narratives slower than the market re-prices assets.
What this means for a US investor who is not already long Japan
Three honest possibilities:
- You missed this specific entry. That is fine. There will be other drawdowns.
- You can still build a position, but you should plan around the fact that the obvious low is behind you. Stagger purchases. Resist concentrated entries. Resist the urge to "make up for missing March" by sizing up at the high.
- You decide it is not worth the work. Owning the asset class via a broad ETF (EWJ for total Japan exposure, DXJ for currency-hedged) is a perfectly defensible choice. Most US investors lack the time to maintain a watchlist of individual JPX names, and a broad ETF still captures the structural tailwinds without single-name idiosyncratic risk.
The mistake is to combine the worst of each path: chasing single names at the high without doing the watchlist work.
What is actually driving the rally — and what is not
| Metric | Japan | US (S&P 500) |
|---|---|---|
| Forward P/E (12m) | ~15.5x | ~21x |
| Trailing P/B | ~1.5x | ~4.5x |
| Trailing dividend yield | ~2.0% | ~1.4% |
| TOPIX-level dividend yield | ~2.4% | n/a |
| Quality high-dividend basket | ~4.0% | ~3.5% (SCHD) |
The drivers are now well-documented:
- Corporate governance reform. The Tokyo Stock Exchange's persistent push on companies trading below book value continues to drive buybacks and progressive dividend policies.
- Real wages turning positive. This matters disproportionately for domestic-demand names — telecom, retail, J-REITs.
- A reformed but still-easy BoJ. Rate normalization remains the path, but the pace is gradual enough that equity multiples have not been pressured.
- Foreign flows. Persistent net buying by global institutional money, with Berkshire's continued enthusiasm for the sogo shosha trading houses providing the visible headline.
What is not primarily driving the rally:
- A weak yen. The yen has stabilized into a range; the move is being earned through operating performance, not translation.
- A tech bubble. Speculative growth and unprofitable tech have not led.
- Easy comparisons. Earnings growth has been real, not solely "below low base effect."
The composition of leadership matters because it tells you whether the rally is durable. So far, the answer is closer to "yes" than to most prior Japanese rallies of the past two decades.
A caveat about Nikkei vs TOPIX
This deserves its own short section. The Nikkei 225 is a price-weighted index of 225 names; three names — Fast Retailing, Advantest, Tokyo Electron — drive a disproportionate share of the index move. TOPIX is market-cap weighted across ~1,700 names; its top 10 names together account for ~22% of the index.
| TOPIX | Nikkei 225 | |
|---|---|---|
| Weighting method | Market-cap weighted | Price weighted |
| Number of constituents | ~1,700 | 225 |
| Top 10 names' share | ~22% | ~50% |
| Top 3 names' share | ~10% | ~26% |
| Practical read | Reflects the broad market | Distorted by a few high-priced names |
A practical read: TOPIX has moved up, but not nearly as forcefully as the Nikkei. The "Japan at a record high" headline is partially a story about three specific names being expensive, not a story about the entire Japanese market being in a frenzy.
For a US investor evaluating "is Japan overheated," look at the Topix yield, P/B, and forward P/E rather than the Nikkei headline number. The Topix-level picture is materially calmer than the Nikkei coverage suggests.
The timing-vs-process question
The question every US investor will ask in May 2026 is "should I buy at an all-time high?" The honest answer:
- The all-time high, by itself, is not a sell signal or a wait signal. Markets that compound positive returns make all-time highs routinely.
- What matters is the income yield and the valuation you pay relative to forward cash flows. A quality-screened Japanese basket at ~4% trailing yield, with Topix trading at ~1.5x book and a forward P/E in the mid-teens, is not an obvious top.
- Position sizing and dollar-cost averaging matter more than entry timing. Staggering purchases over weeks is almost always a better behavioral choice than waiting for a precise level that never arrives.
- The behavioral mistake at all-time highs is to freeze while extrapolating the recent past forward. The discipline that compounds is to assess price-to-income today and act accordingly, not to wait for an entry the market may not give you.
Risks that would invalidate the thesis
- A reversal in BoJ communication. A faster-than-expected tightening path compresses equity multiples.
- Yen strength. Sharp yen appreciation compresses translated earnings for the export-heavy index members.
- US tariff escalation. Japan tends to get dragged along even when its direct China exposure is more modest than headlines suggest.
- Single-name governance shocks. Mega-cap status is not insurance — the recent KDDI accounting issues are a reminder.
What to do, practically
| Situation | Reasonable response |
|---|---|
| Long Japan, comfortable | Hold. Rebalance only if any single name has exceeded your sizing rule. |
| Long Japan, uncomfortable | Trim the most over-extended single names. Do not exit the asset class because of the headline. |
| Not long, want exposure | Start with a small initial position via EWJ or sponsored ADRs. Stagger over 8–12 weeks. Resist the urge to size up "to catch up." |
| Not long, do not want the work | Buy a broad-Japan ETF or stay out. There is no obligation to participate in every market. |
Closing
The most useful framing for any all-time-high headline is the one the original short note implied: who actually captured this move, and what does your own behavior over the prior 60 days tell you about whether you were one of them?
For US dividend investors specifically, the Nikkei at a record high is not a reason to engage or to avoid Japan. The reasons to engage are the same as they were in March, in February, and last year: a materially higher starting income yield, a genuine corporate governance reform tailwind, and a reasonable starting valuation. The reasons to avoid are also unchanged: currency risk, single-name idiosyncratic risk, and the operational overhead of running a JPX watchlist.